

78. Methods Of Comparing The Biological Values Of Individual Proteins
Description
This section is from the book "The Newer Knowledge Of Nutrition", by Elmer Verner McCollum. Also available from Amazon: The Newer Knowledge of Nutrition: The Use of Food for the Preservation of Vitality and Health.
78. Methods Of Comparing The Biological Values Of Individual Proteins
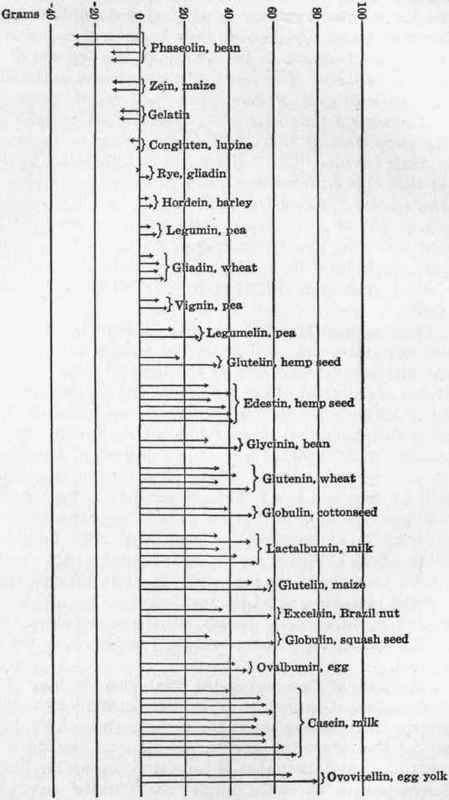
One method which they employed to illustrate the striking differences in the values of the proteins from different sources for the support of growth, was that of feeding a series of groups of animals on a diet of constant composition, but with a different protein, carefully isolated and purified, as a component in the diet of each experimental group. The amount of growth or of loss in body weight of the animals during the first thirty days on the experimental diets was recorded and made,
The above table is slightly modified from a publication by Osborne and Mendel, Zeit, if. physiol, Chem., 1912, lxxx, 307, the basis of comparison. The diet consisted of the following substances:
Purified protein ............... 18.0 per cent
"Protein-free milk" ............. 28.2 " "
Starch .................... 20.8 " "
Agar-agar .................. 5.0 " "
Fat ..................... 28.0 " "
The results obtained with a series of proteins are shown in graphic form in the diagram on page 68.
An inspection of this table shows that animals restricted to bean protein lost weight rapidly. Those fed zein, the principal protein of the maize kernel, and also those fed gelatin lost weight, but not so rapidly. Conglutin, a protein from the lupine, and gliadin of rye, served to maintain weight without growth, and little growth was secured with hordein of barley or legumin of pea. All the other proteins listed were capable of promoting growth when fed with the other substances in the diet.
A second method which Osborne and Mendel employed for the comparison of the biological values of different proteins for growth in the rat, was to observe the rapidity of growth of the animals when fed diets of the type described above, in which but a single protein was added, the character of the protein varying in different experiments (30). A third method was to carefully establish the amount of increase in body weight which was possible as the result of the consumption of a definite amount of protein, the nature of the remainder of the food mixture remaining essentially constant throughout the series of experiments (31). As an illustration of the results secured by the latter method the following table is representative:
Rat | Diet | Initial body weight | Gain | Intake of | ||
Total food | Protein | |||||
grams | grams | days | grams | grams | ||
2115 | 9% lactalbumin............. | 65 | 99 | 80 | 589 | 43.7 |
2123 | " "............... | 43 | 89 | 80 | 395 | 29.3 |
2207 | " "............... | 59 | 91 | 80 | 575 | 42.6 |
2210 | " "............... | 60 | 93 | 80 | 560 | 41.5 |
2051 | 9% casein (cow's milk)..... | 42 | 59 | 80 | 435 | 35.2 |
2110 | 9% edestin (hemp seed)..... | 52 | 60 | 80 | 465 | 38.9 |
2044 | 4½% lactalbumin (milk).... | 42 | 44 | 80 | 371 | 13.8 |
2049 | 4½% lactalbumin.......... | 41 | 54 | 80 | 454 | 16.8 |
2118 | 4½% casein............... | 59 | -3 | 80 | 366 | 14.8 |
2113 | 4½% edestin.............. | 83 | 14 | 80 | 459 | 19.2 |
2114 | 4½% casein............... | 65 | 29 | 80 | 464 | 19.4 |
It will be observed that rats which ate similar amounts of food grew much faster on 9 per cent of lactalbumin than on casein or edestin. Similar differences were observed when the lower protein intake was fed. At the time these experiments were carried out it was believed by Osborne and Mendel that they actually represented quantitative comparisons of the values of these proteins for growth. It will be apparent from data discussed later in this chapter in connection with the nutritive value of gliadin, that lactalbumin as the sole source of protein cannot support any growth whatever. Its excellent showing in the above experiments was due to the supplementary action of the amino-acids contained in the "protein-free milk" which was fed with it.
Continue to:


My Books