Speed Of The Finger Movements #2. Continued
Description
This section is from the book "Human Vitality And Efficiency Under Prolonged Restricted Diet", by Francis G.BENEDICT, Walter R. Miles, Paul Roth, And H. Monmouth Smith. Also available from Amazon: Human Vitality and Efficiency Under Prolonged Restricted Diet.
Speed Of The Finger Movements #2. Continued
The individual averages in tables 184 and 185 call for no special comment. The group results are plotted in figure 120. Squad A shows a continual decrease from October 28 to December 9. In the evening records, December 8 also showed the poorest record, although the curves were fairly regular up to that time. It may be assumed that the score for October 28 is a little high if the curve for the evening records is taken as a basis, for on the previous evening, October 27, the score was higher than it had been previously by about 1 oscillation. No finger movements were taken on the morning of December 20 on account of the electrocardiograms. There is a high point in the curve for January 13 which corresponds well with that found for the evening of January 12; following this there is a decline on January 27 which is also found on January 26. No records could be taken on the last morning, as the time was given up almost entirely to the walking experiment. The records for Squad B, also shown in figure 120, demonstrate a gradual decline from November 4 to January 14, the first food-reduction experiment. On January 20, the second experiment which came within the food-reduction period, there is a precipitous drop of 4 oscillations from the preceding record of 65.9, which is a decline of 6 per cent. Finger movements could not be taken on the final morning, January 26, on account of the walking experiment.
The finger movement records were counted in blocks of 2 seconds.1 For example, the records of Gul in the evening experiment of September 29 for the five 2-second intervals,2 were 18.6, 16.7, 16.7, 16.4 and 16.2 oscillations in each succeeding 2-second period, with a total of 84.6 oscillations for the 10 seconds; (see table 182). Comparison of the results in such short and successive intervals may be counted on to show the influence of fatigue which, however, in the 10-second test, does not develop to an unpleasant degree. The records, tabulated as illustrated for Gul on the one date, are wonderfully uniform in the amount of decrease from one 2-second period to the next; in conselThe tables for finger movements given by Miles, Carnegie Inst. Wash. Pub. No. 266, 1918, p. 86, are in this form. 2These 2-second intervals were accurately marked on the record by the timed jump spark from the recording point (see p. 187). quence it did not seem justifiable to increase the size of tables 182 to 185 fivefold by printing these 2-second data.
The averages are shown diagrammatically in figure 121. To avoid complicating the figure, the results for evening and morning records are grouped separately. The columns or ordinates from left to right are headed I 2 seconds, II 2 seconds, etc. Each curve has a designation. The regularity of decline in the seven curves tells its own story without further discussion. The curves (A and B) for the evening normals are not so straight as are those for the low-diet results (A' and B'). The fall from one 2 seconds to the next 2 seconds is uniformly 0.3 or 0.4 of a complete finger movement. Had we only the evening data of Squad B, it might be thought that early fatigue developed a little more slowly under conditions of food reduction and at the lower level of performance which then obtains. The results with Squad A and the morning results with 3 do not agree; there is thus no consistent indication of a change in fatigue development or latency with the food reduction. The difference in num-ber of finger movements performed under normal and low-diet conditions is substantially the same whether one takes 2, 4, 6, 8, or 10 second records. It is apparently a difference in level rather than one of readiness or fatigue of the process.
It is clear that there was a decrease in the efficiency of the motor coordination of finger movements which quite evidently resulted from the food reduction. The decrease, with fluctuation, is shown in the case of Squad A in both the evening and morning records and was very prominent with Squad B during the three weeks' period of food reduction. Judging from the evening records of Squad A, the decrease in the finger movements incident to the food reduction was fully 5 per cent.1 Squad A during the greater number of experiments were below B, even though they were normally capable of a faster rate than B, as was shown on September 29.
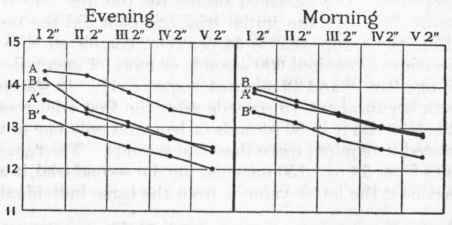
Fig. 121. - Number of finger movements performed in successive 2-second intervals.
The scale at the left shows complete oscillations. Results for evening and morning records are diagrammed separately. A, Squad A normal; B, Squad B normal; A', Squad A on low diet; B', Squad B on low diet.
1Four of the evening experiments during food reduction show a decrement as great or greater than 6.4 per cent.
Continue to:
My Books

