(15) Speed Of The Finger Movements #2
Description
This section is from the book "Human Vitality And Efficiency Under Prolonged Restricted Diet", by Francis G.BENEDICT, Walter R. Miles, Paul Roth, And H. Monmouth Smith. Also available from Amazon: Human Vitality and Efficiency Under Prolonged Restricted Diet.
(15) Speed Of The Finger Movements #2
In this muscle coordination test the number of complete oscillations of the finger which the average individual can perform in 10 seconds ranges between 55 and 75. In the normal series of 1917 finger-movement records were obtained on 61 of the men, the records were photographic, and were extended for only 8 seconds. The average for the group of 61 normal men in the 1917 series on whom such records were taken was 52.1 complete oscillations in 8 seconds. The records made in the evening for Squads A and B are given in tables 182 and 183. The average performance on the normal date (September 29) for Squad A was 68.7 oscillations; the average for the first experiment with Squad B was 66.0 oscillations. The foregoing values are for records 10 seconds long. If we count only the first 8 seconds so as to make them comparable with the normal series of 1917, the initial normal results are 55.7 and 53.7 oscillations for A and B, respectively. Thus the two groups of men agree fairly well with each other and with the larger normal group. With Squad A the individual normal averages range from 52.3 oscillations for Tom to 84.6 oscillations for Gul. This last figure is unusually high. Gul has previously been noted as a rather short, extremely intense individual. With Squad B the range for the first experiment for the individual subjects is smaller, being from 58.2 for How to 72.5 for Wil. The members of A show individual averages exclusive of the first (normal) experiment, which range from 56.5 oscillations for Moy to 77.5 oscillations for Gar. The average for the 10 subjects for the nine evening experiments is 65.1 oscillations. Squad B show individual averages for their five normal evening experiments which range from 58.6 (How) to 75.2 (Van), with a total average of 65.6 oscillations. For the three evening experiments during the reduced diet period the average is 62.7 oscillations, a reduction from the normal average of 2.9 oscillations, which corresponds to 4.4 per cent. The difference between the normal of Squad A and the average for their nine low-diet periods is 3.6 oscillations, amounting to 5.2 per cent of the normal.
Table 182. - Squad A - Number Of Finger Movements Performed In 10 Seconds At Evening Sessions
Date. | Bro. | Can. | Kon. | Gar. | Gul. | Mon. | Moy. | Pea. | Pec. | Spe. | Tom. | Vea. | Fre. | Av. |
1917. | ||||||||||||||
Sept. 29............ | 75.6 | 60.5 | 56.5 | 79.3 | 84.6 | 55.4 | 63.3 | 64.5 | 76.8 | 73.1 | 52.3 | 75.1 | 60.9 | 68.7 |
Oct. 13............ | 71.7 | 59.1 | 76.8 | 73.5 | 49.7 | 58.8 | 62.6 | 78.1 | 69.4 | 53.8 | 71.7 | 57.6 | 65.6 | |
Oct. 27............ | 71.1 | 59.0 | 62.4 | 80.6 | 76.8 | 50.1 | 60.9 | 61.2 | 80.7 | 74.5 | 57.3 | 67.8 | ... | 66.6 |
Nov. 10............ | 69 8 | 60 9 | 57.1 | 75 9 | 74 1 | 52 4 | 57.1 | 61 0 | 72.5 | 72.4 | 53.5 | 65.1 | ... | 64.2 |
Nov. 24............ | 72.8 | 60.2 | 54.8 | 80.8 | 67.8 | 57.9 | 57.6 | 58.4 | 70.2 | 67.5 | 55.5 | 61.8 | .... | 64.3 |
Dec. 8............ | 72.4 | 59.4 | 56.2 | 73.7 | 65.4 | 59.8 | 54.7 | 59.7 | 68.2 | 67.4 | 57.2 | 63.3 | .... | 63.4 |
Dec. 19............ | 71.9 | 61.8 | 57.7 | 75.2 | 64.4 | 60.3 | 61.4 | 58.0 | 69.9 | .... | 59.3 | 67.1 | .... | 64.9 |
1918. | ||||||||||||||
Jan. 12... | 71.7 | 59.2 | 62.2 | 76.6 | 75.5 | 58.4 | 51.1 | 60.1 | 75.7 | . . . | 59.7 | 66.4 | .... | 65.4 |
Jan. 20... | 70.8 | 62.0 | 59.7 | 75.2 | 67.5 | 60.0 | 50.7 | 59.1 | 68.8 | .... | 57.9 | 63.2 | .... | 63.5 |
Feb. 2............ | 69.6 | 62.9 | 55.1 | 82.4 | 78.4 | 61.6 | 55.8 | 64.4 | 74.0 | .. | 60.7 | 66.5 | .. | 67.6 |
Low-diet average. . | 71.3 | 60.5 | 58.2 | 77.5 | 71.5 | 56.7 | 56.5 | 60.5 | 73.1 | 70.2 | 57.2 | 65.9 | .. | 65.1 |
Table 183. - Squad B - Number Of Finger Movements Performed In 10 Seconds At Evening Sessions
Date. | Fis. | Har. | How. | Ham. | McM. | Kim. | Lon. | Mac. | Sch. | Liv. | Sne. | Tho. | Van. | Wil. | Av. |
1917. | |||||||||||||||
Oct. 6........ | 65.1 | 63.3 | 58.2 | 67.7 | 60.9 | 65.3 | .... | 68.1 | 70.7 | 67.3 | . • • • | 72.5 | 66.0 | ||
Nov. 3........ | 61.1 | 60.1 | 58.7 | 72.0 | 68.0 | 57.2 | 59.8 | 66.7 | 65.6 | 65.2 | 71.9 | 73.8 | 65.2 | ||
Nov. 17........ | 60.0 | 58.7 | 58.3 | 71.0 | 76.3 | 60.8 | 62.5 | 69.9 | 68.8 | 61.9 | 76.0 | 70.1 | 65.6 | ||
Dec. 15........ | 58.2 | 57.5 | 64.3 | 78.9 | 59.3 | 66.5 | 69.1 | 65.8 | 62.8 | 75.5 | 70.2 | 64.7 | |||
1918. | |||||||||||||||
62.3 | 59.1 | 60.4 | 67.7 | 72.5 | 60.2 | 65.6 | 65.9 | 67.8 | 61.4 | 77.2 | 76.3 | 66.5 | |||
Normal av... | 62.1 | 59.9 | 58.6 | 68.5 | 73.9 | 60.2 | 59.5 | 63.5 | 65.6 | 67.8 | 67.7 | 63.7 | 75.2 | 72.6 | 65.6 |
Jan. 13........ | 58.6 | 58.9 | 58.0 | 64.5 | 67.1 | 55.9 | 70.6 | 70.0 | 68.7 | 60.2 | 75.1 | 71.7 | 64.2 | ||
Jan. 19........ | 62.1 | 55.6 | 55.7 | 63.1 | 63.4 | 55.5 | 69.9 | 64.4 | 66.6 | 60.4 | 74.8 | 65.4 | 62.4 | ||
Jan. 27........ | 54.5 | 60.4 | 51.5 | 65.6 | 58.1 | 55.6 | .. | 73.4 | 68.1 | 63.4 | 56.0 | 72.8 | 66.4 | 61.4 | |
Low-diet av.. | 58.4 | 58.3 | 55.1 | 64.4 | .. | 62.9 | 55.7 | ... | 71.3 | 67.5 | 66.2 | 58.9 | 74.2 | 67.8 | 62.7 |
The course of the changes in these finger-movement records is made clear by figure 119. There are fluctuations, but it is very evident that Squad A on the average for the 10 men did better in their normal experiment than at any other time. The total number of finger movements in 10 seconds rather regularly decreased to December 8. There was some recovery on December 19 and January 12, a conspicuous fall on January 26 with an evident spurt at the last session on February 2. Squad B did not show their highest point until January 5. Previous to this time the fluctuations tended, in general, toward a slight decrease, amounting, between October 6 and December 15, to a little more than one oscillation. The decrease during the normal period for Squad B is not nearly so prominent as the decrease in the case of Squad A. The three experiments of January 13, 19, and 27, which fall in the food-reduction portion of the experiment for Squad B, show a definite and progressive decrease in the number of finger movements performed in 10 seconds, and all are below the previous records for this squad. The records for the last two dates are considerably lower than any of those found for Squad A.
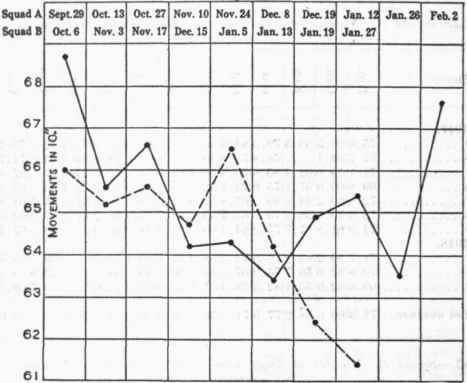
Fig. 119. - Number of finger movements performed in 10 seconds at evening sessions.
Solid lines represent Squad A, broken lines Squad B.
Table 184. - Squad A - Number Of Finger Movements Performed In 10 Seconds At Morning Sessions
Date. | Bro. | Can. | Kon. | Gar. | Gul. | Mon. | Moy. | Pea. | Pec. | Spe. | Tom. | Vea. | Av. |
1917. | |||||||||||||
Oct. 28................. | 74.3 | 64.0 | 61.7 | 79.5 | 79.9 | 54.4 | 61.3 | 63.6 | 74.0 | 79.8 | 56.1 | 70.7 | 67.8 |
Nov.11... | 74.6 | 63.4 | 66.6 | 74.9 | 76.9 | 55.1 | 56.1 | 64.0 | 73.9 | 64.4 | 56.8 | 68.8 | 66.5 |
Nov. 25................. | 70.8 | 61 0 | 61.5 | 82.5 | 65 5 | 58 0 | 58 7 | 61.0 | 71.2 | 70.9 | 57.6 | 69.5 | 65.6 |
Dec. 9.. | 70.2 | 61.2 | 58.5 | 75.6 | 68.5 | 61.2 | .55.7 | 65.1 | 70.1 | 66.6 | 56.6 | 69.5 | 65.4 |
1918. | |||||||||||||
Jan. 13 | 67 0 | 63 7 | 67 7 | 77? | 70.9 | 60 8 | 57 7 | 63 4 | 75.3 | .. | 61.1 | 71.8 | 66.9 |
Jan.27... | 62.1 | 63.3 | 58.7 | 73.1 | 77.4 | 63.5 | 56.6 | 62.5 | 71.1 | .. | 58.8 | 68.3 | 65.7 |
Low-diet average... | 69.8 | 62.8 | 62.5 | 77.1 | 73.2 | 58.8 | 57.7 | 63.3 | 72.6 | 70.4 | 57.8 | 69.8 | 66.3 |
Table 185. - Squad B - Number Of Finger Movements Performed In 10 Seconds At Morning Sessions
Date. | Fis. | Har. | How. | Ham. | McM. | Kim. | Lon. | Mac. | Sch. | Liv. | Sne. | Tho. | Van. | Wil. | Av. |
1917. | |||||||||||||||
Nov. 4........ | 64.5 | 56.6 | 56.4 | 69.5 | 72.3 | .... | 60.9 | 63.4 | .... | 71.2 | 71.8 | 70.1 | 76.1 | 71.8 | 66.9 |
Nov. 18........ | 58.0 | 62.7 | 57.9 | 72.5 | 77.8 | .... | 61.0 | 62.0 | .... | 69.2 | 69.1 | 63.2 | 77.4 | 72.1 | 66.3 |
Dec. 16........ | 55.2 | 57.9 | 69.8 | 73.3 | .... | 58.4 | 62.3 | 68.1 | 70.5 | 64.5 | 75.0 | 73.8 | 66.0 | ||
Normal av... | 61.3 | 58.2 | 57.4 | 70.6 | 74.5 | 60.1 | 62.6 | 69.5 | 70.5 | 65.9 | 76.2 | 72.6 | 66.4 | ||
1918. | |||||||||||||||
Jan 14 ........ | 62.9 | 59.5 | 59.3 | 68.5 | . • ■ • | 57.6 | 61.3 | . . . | 76.7 | 66.0 | 69.9 | 64.3 | 75.3 | 72.3 | 65.9 |
Jan. 20........ | 57.7 | 56.9 | 54.6 | 67.9 | ----- | 58.6 | 55.6 | ----- | 70.5 | 67.1 | 63.5 | 61.3 | 76.7 | 57.7 | 61.9 |
Low-diet av.. | 60.3 | 58.2 | 57.0 | 68.2 | .... | 58.1 | 58.5 | ----- | 73.6 | 66.6 | 66.7 | 62.8 | 76.0 | 65.0 | 63.9 |
Before drawing final conclusions regarding the relation of the low diet to this muscle-coordination test, we must inspect the data taken in the morning trials. These data are presented in tables 184 and 185. The average performance for Squad A the first time these morning measurements were made was 67.8 oscillations. This experiment was made on the morning following the third evening experiment, for the morning finger-movement tests were not begun until after Squad A had been several weeks on low diet. Hence this figure can not be compared directly with the normal for the evening of September 29, but should be compared with the value for the evening of October 27, which is 66.6 oscillations. It is therefore 1.2 oscillations higher than the evening record. The morning record for November 11, which is 66.5 oscillations, should likewise be compared with the evening record of November 10 of 64.2 oscillations, the difference in favor of the morning record being 2.3 oscillations. This difference of approximately two oscillations applies throughout the records, the morning records always being the higher for Squad A. With Squad B, if we compare the evening of November 3 with the morning of November 4, the scores are, respectively, 65.2 and 66.9 oscillations, a difference of 1.7 oscillations in favor of the morning. Throughout the measurements for Squad B, the morning tests give a higher score by approximately 1.5 oscillations. The two series of finger movements are thus in entire contrast to the results found in the strength of grip test in which the evening performance was the better. (See p. 585).
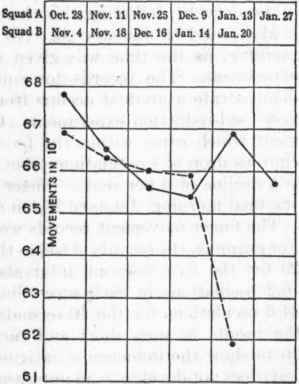
Fig. 120. - Number of finger movements performed in 10 seconds at morning sessions.
Solid lines represent Squad A, broken lines Squad B.
Continue to:
My Books

