General Body Condition. Continued
Description
This section is from the book "Human Vitality And Efficiency Under Prolonged Restricted Diet", by Francis G.BENEDICT, Walter R. Miles, Paul Roth, And H. Monmouth Smith. Also available from Amazon: Human Vitality and Efficiency Under Prolonged Restricted Diet.
General Body Condition. Continued
The period of loss in weight for Squad B was approximately 21 days. The losses in weight and in the five major girths during this period with these subjects are also given in table 17, together with the initial body-weight and percentage loss in weight. While a direct comparison of these losses is hardly justifiable, since the men were not of the same general contour, yet it is evident that the decreases are less than those found for Squad A. The final percentage loss in body-weight for this squad was but 6.5 per cent, as compared with 10.7 per cent with Squad A. If we take as a general index of decrease in these measurements the averages of the values for G, M, N, P, and Q, we find that they range from a maximum of 5.3 cm. with Liv, to a minimum of 2.3 cm. for Tho, the average for the whole group being 3.4 cm. This is perceptibly smaller than the average for Squad A, which was 4.4 cm.
The degree of emaciation produced by the restriction in diet may also be shown to some extent by means of the profile photographs given in figures 74 to 85. These were taken of the men in Squad A at the end of the experiment, i. e., on February 2, 1918. For comparison, a photograph is also given of one subject (Can) which was taken on September 29, before the restriction in diet began. A loss in weight of 10 per cent or even, as with Can, 13 per cent, does not of course, produce an effect which is especially evident. We believe, however, that photographic records of this type are important, particularly for hospital cases, and are strongly to be recommended. In reduction cures for obesity, particularly, such photographs might be of specific value.
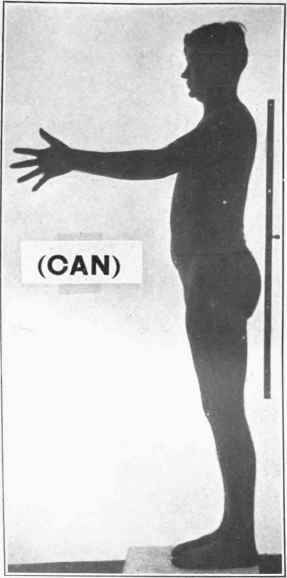
Fig. 74. - Photograph of Can. Sept. 29,1917. Beginning of experiment.
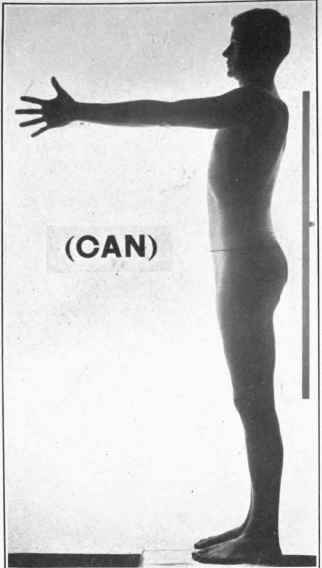
Fig. 75. - Can, Feb. 2, 1918. End of experiment.
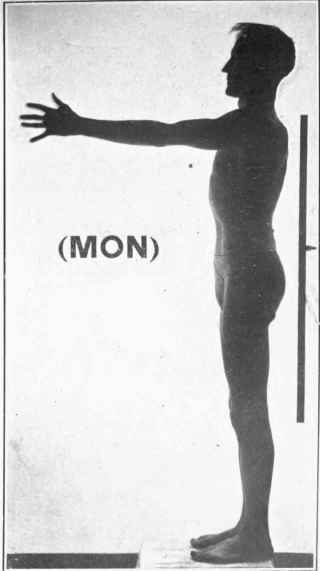
Fig. 76. - Mon Feb. 2, 1918.
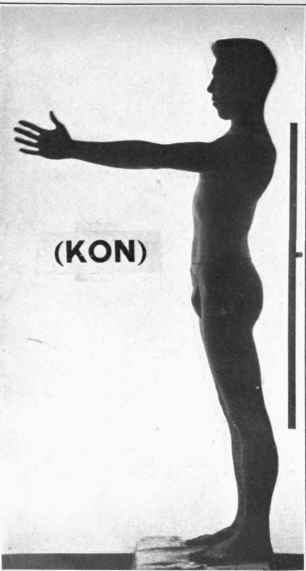
Fig. 77. - Photograph of Kon, Feb. 2, 1918.
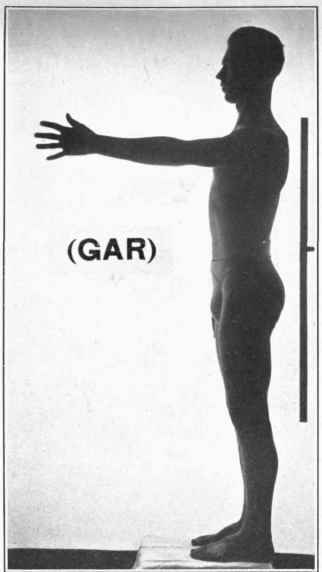
Fig. 78. - Gar, Feb. 2, 1918.
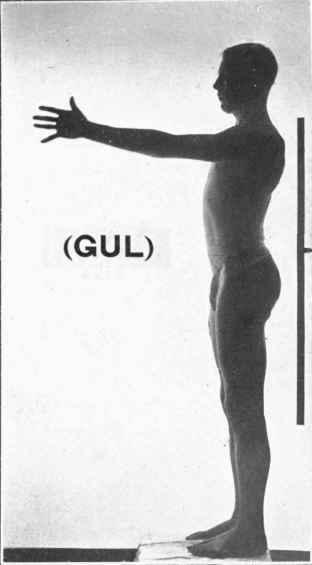
Fig. 79. - Gul, Feb. 2, 1918.
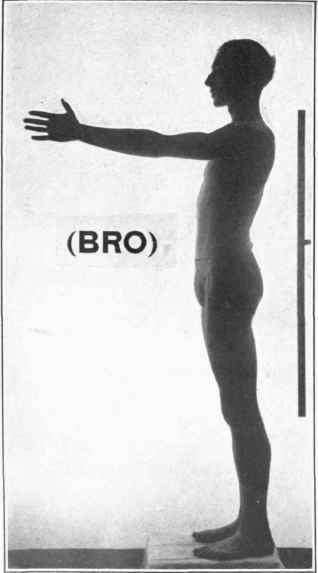
Fig. 80. - Photograph of Bro, Feb. 2, 1918.
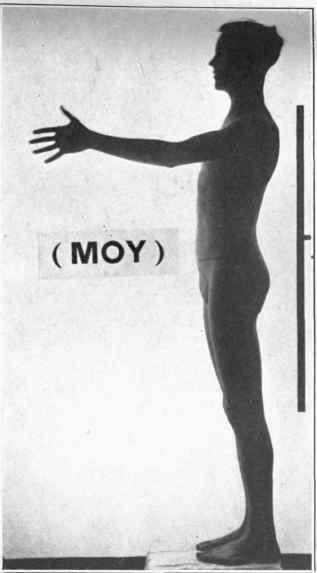
Fig. 81. - Moy, Feb. 2, 1918.
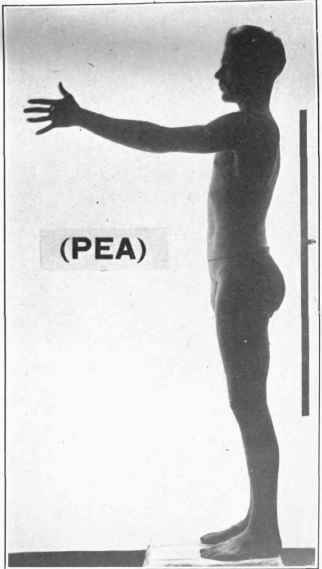
Fig. 82. - Pea, Feb. 2, 1918.
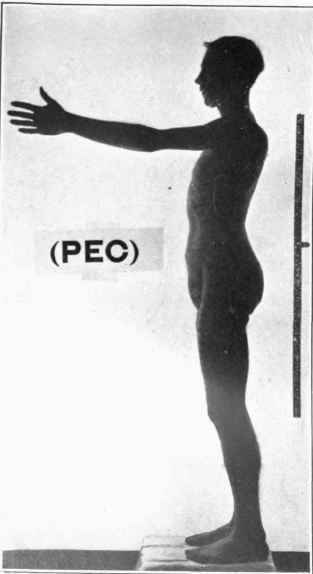
Fig. 83. - Photograph of Pec, Feb 2, 1918.
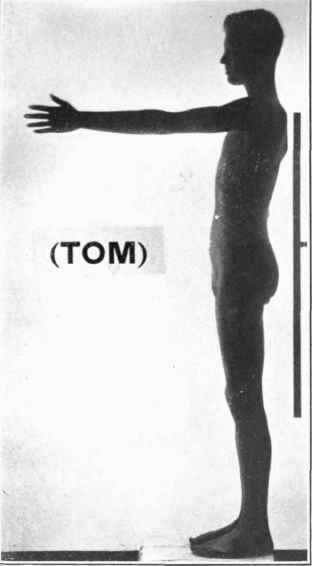
Fig. 84. - Tom Feb. 2, 1918.
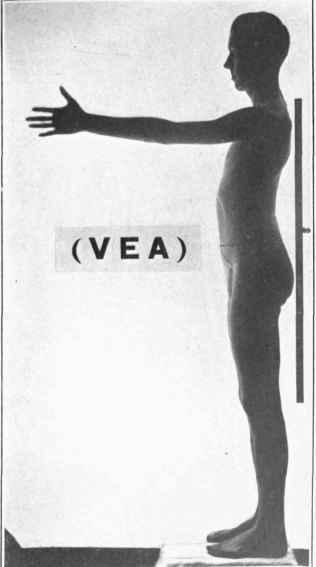
Fig. 85. - Vea, Feb. 2, 1918.
In addition to the profile photographs, a group photograph was taken of Squad A in November, when they had nearly reached their minimum weight. This group photograph, which is reproduced in figure 86, was taken on the lawn near the Laboratory and gives a good indication of the appearance of the men at that period of the research. Knowing that these men are on a reduced diet, one may perhaps discern the evidence of emaciation, with possibly a drawn look in the face, but had these men been in company with other college men on the campus, it would have been very difficult for any one to have selected them as members of the diet squad without previous knowledge of that fact. In other words, these men were not greatly dissimilar in appearance from their fellow students. Another group photograph was taken on January 11, 1918, in which not only Squad A but also Squad B and the investigators were included. (See frontispiece.) On this date Squad B had been but 3 days on a reduced diet, and hence were practically in a normal condition.
Continue to:
My Books

