Discrimination For The Pitch Of Tones #2. Continued
Description
This section is from the book "Human Vitality And Efficiency Under Prolonged Restricted Diet", by Francis G.BENEDICT, Walter R. Miles, Paul Roth, And H. Monmouth Smith. Also available from Amazon: Human Vitality and Efficiency Under Prolonged Restricted Diet.
Discrimination For The Pitch Of Tones #2. Continued
The data in table 150 for Squad B show no marked peculiarities which differentiate them from those for Squad A. There was considerable improvement between the first and second dates, October 6 and November 3, although these were separated by one month. Individual averages for the 5 normal periods are on the whole not quite so high as those shown for the 9 periods for Squad A. As many of the values for Van are below 50 per cent, they have not been included with the others in the group averages. The averages for the remaining 9 regular subjects show a total for the normal period of 90, 82, 72, and 62 per cent correct judgment for intervals 5, 3, 2, and 1 vd., respectively. Again, 2 vd. appears to be very near the normal threshold for this group.
The total comparable averages for intervals 5, 3, 2, and 1 vd. for the two squads on the different dates are most conveniently compared in diagrammatic form, as in figure 103. The 8 curves give a somewhat confusing appearance to the figure. It will, however, be seen that the results for the different increments are for a particular squad at different levels. The four curves for Squad B do not touch or cross each other at any point, showing consistently the increasing difficulty of increments 5 to 1 vd., since on each date the percentage of correct judgments regularly decreases. The same is true for the four curves of Squad A, with the single exception of the curves for 3 and 2 vd. on September 29, which begin at almost the same point. The confused appearance is therefore due to the fact that the two squads in general have so nearly the same level for the different pitcR-discrimination increments.
In the case of 5 vd. the two curves ascend about equally between the first and second experiments and thereafter maintain approximately the same level, which is very near 95 per cent. Squad B shows some depression on December 15, due to the unaccountably poor records for Har and How of 77 and 73 per cent (see table 150), which are considerably lower than usual for these two subjects. From the fifth session to the close of the experiment the two squads show uniform results.
With 3 vd., improvement is evident between the first and second experiments, Squad B indicating about the same improvement as with 5 vd. Squad A shows considerable improvement, but this is due to the unexplainable fact that the threshold for 3 vd. on September 29 was abnormally low. The record for several of the subjects, i. e., Bro, May, Gar, Tom and Vea, is only 50 to 60 per cent correct judgment (see table 149). Some improvement is evident in the next two sessions (experiments 3 and 4). The decline in experiment 5 of itself is perhaps not significant, but it is the beginning of the depression in the curve during the next four sessions, that is, December 8 to January 26, which is fairly well marked. There is recovery to the highest level on February 2. Squad B shows depression for 3 vd. on December 15 and January 5, that is, just before and just following the Christmas vacation, with a drop on January 27.
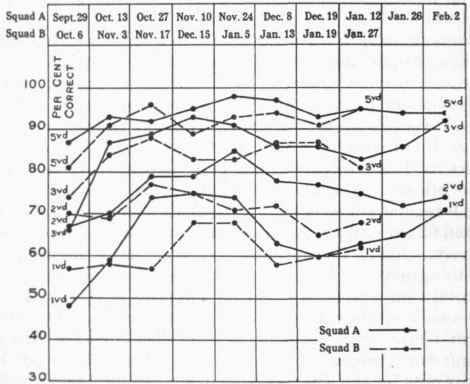
Fig. 103. - Percentage of correct judgments in discriminating the pitch of tones.
For 2 vd. the curves start at about the same level; there is almost no improvement between the first and second experiments; there is, however, considerable improvement between the second and third experiments. Specifically, Squad A continued to improve after this date and reached their highest value on November 24. From December 8 to the end of the experiment there was a decrement. Squad B showed a decrease on January 5, to a score of 71 per cent. January 13, the first reduced-diet date, was at about the same level, and on the following two dates the values are still lower; in fact, lower than for the first and second experiments.
With 1 vd. Squad A showed considerable improvement at the start. Their first threshold was, however, undoubtedly too low, being only 48 per cent. Their maximum level was attained in the third, fourth, and fifth sessions and maintained very evenly. Beginning with December 8 there was a marked depression, with some recovery on January 26 and February 2, especially on the latter date, but it did not reach the former level. Squad B shows a continuing low level for the first three sessions. The expected improvement from practice with this most difficult judgment of the series does not reach a maximum in the third test as do the other curves for this squad but, as might naturally occur, is delayed until the fourth and fifth sessions. The remaining points in the curve represent January 13,19, and 27, the food reduction period, when there was a considerable decrease in the percentage of correct judgments with the 1 vd. interval.
In this pitch discrimination test, the records of most interest are those for the increments 3, 2, and 1 vd., which were near the threshold value and thus required the greatest care and attention for correct judgment. The average results for Squad B are fairly consistent in demonstrating poorer discrimination during the low-diet period. This is quite noticeable in the two smallest increments. For Squad A an adequate base fine is lacking but beginning with December 8, these men on the average not only failed to improve over former results but for the remainder of the research show a general decrement, which is associated with the prolongation of the reduced diet regime.
Continue to:
My Books

